

What is Trendline?
Trendline is an indicator designed to automatically track all trend lines (trendline) on the chart and signals when they are broken, adapting to any symbol and timeframe. With the ability to customize length, touches, colors, and line style.
Main Advantages of Trendline
Immediate Visualization
See all detected trendlines automatically on your chart in real-time, without having to draw them manually. The indicator adapts to any symbol and timeframe.
Trendline Notifications
Receive automatic alerts when a trendline is broken, allowing you to immediately identify potential trend reversals and trading opportunities.
Ease of Analysis
Easily analyze dynamic support and resistance levels. Customize length, touches, colors, and line style to match your trading style.


How Trendline Works
Trendline uses advanced algorithms to automatically track trend lines (trendline) on the chart and signal breakouts, providing traders with crucial market dynamics information.
Trendline Details and Settings
Trendline offers a series of customizable settings that allow traders to adapt the indicator to their specific needs and trading strategies.

Details and Settings
Configure the indicator according to your preferences. Modify length parameters, required touches, timeframes, and display options to optimize technical analysis.
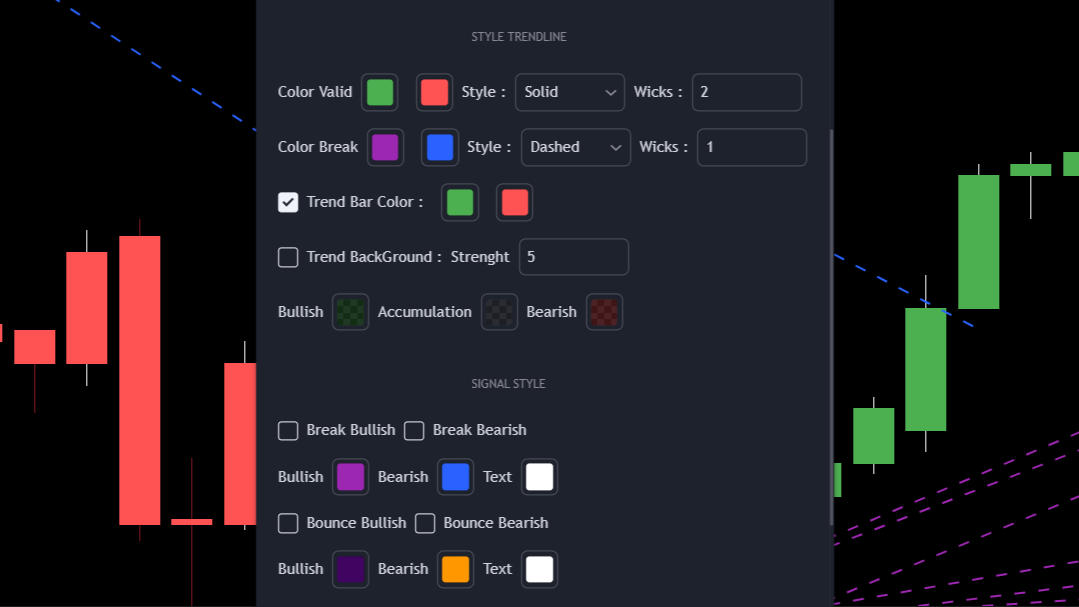
Trendline Customization
Modify the necessary touches, length, and type of trendlines displayed on the chart. You can choose to display active levels, broken ones, or both.

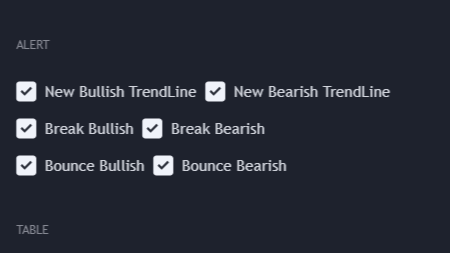
Personalized Alerts
Set alerts for breakouts, bounces, or creation of new trendlines. Stay updated on market dynamics without having to constantly monitor the chart.
Table
Utilize a detailed table that shows the values of all active trendlines, allowing you to easily monitor key market points.
How to Use Trendline
Trendline delivers capabilities that help traders understand and leverage market trends, turning clear visual information into confident actions.
Display every trendline on the chart and treat them as critical references for market structure, support/resistance and momentum shifts.
Trendline Specific Questions
Yes, Trendline is compatible with any timeframe and adapts to the current chart to plot lines accurately.