

What is Support and Resistance?
Support and Resistance is an indicator that automatically tracks key Support and Resistance levels on any symbol and timeframe, including higher ones. It saves a lot of time on manual analysis and features various alerts to keep you updated on potential reversals, continuations, and level bounces.
Main Advantages of Support and Resistance
Automatic Level Identification
Tracks all support and resistance levels, eliminating uncertainty and providing a clear map of key points on the chart.
Dynamic Trend Creation
Automatically identifies and updates trends based on level breakouts, facilitating understanding of market directions.
Automatic Fibonacci
Generates Fibonacci levels based on the last two support and resistance levels, providing additional reference points for potential price retracements or extensions.
Personalized Alerts
Offers a range of configurable alerts to keep you updated on breakouts, new confirmed levels, and bounces off levels, improving responsiveness in trading decisions.


How Support and Resistance Works
Support and Resistance automatically identifies key support and resistance levels, eliminating the need for manual analysis. The indicator generates real-time levels with detailed data, providing a clear view of areas of interest in the market.
Support and Resistance Details and Settings
Support and Resistance offers a range of customizable settings to adapt to the specific needs of each trader and optimize their trading strategies.
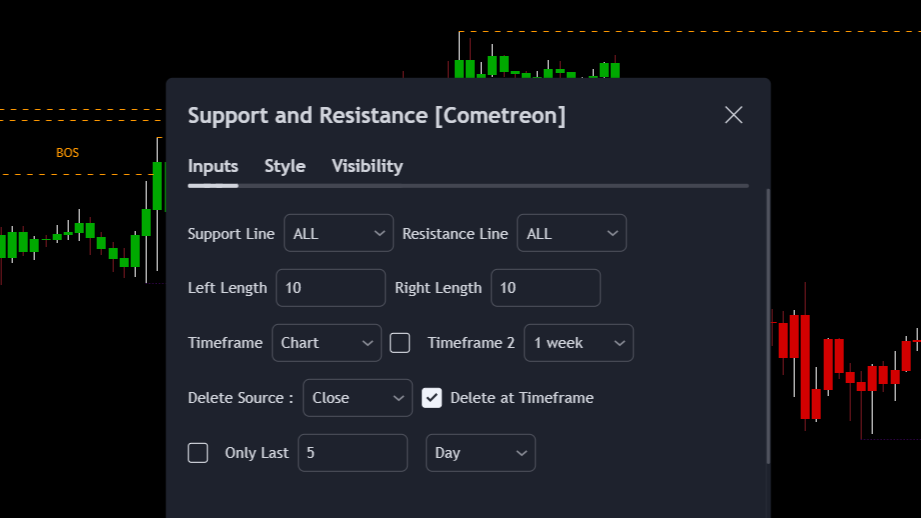
Level Customization
Modify the length, timeframe, and type of support and resistance levels displayed on the chart. You can choose to display only active levels, include broken ones, or select levels based on higher timeframes for greater precision and even add a second level.
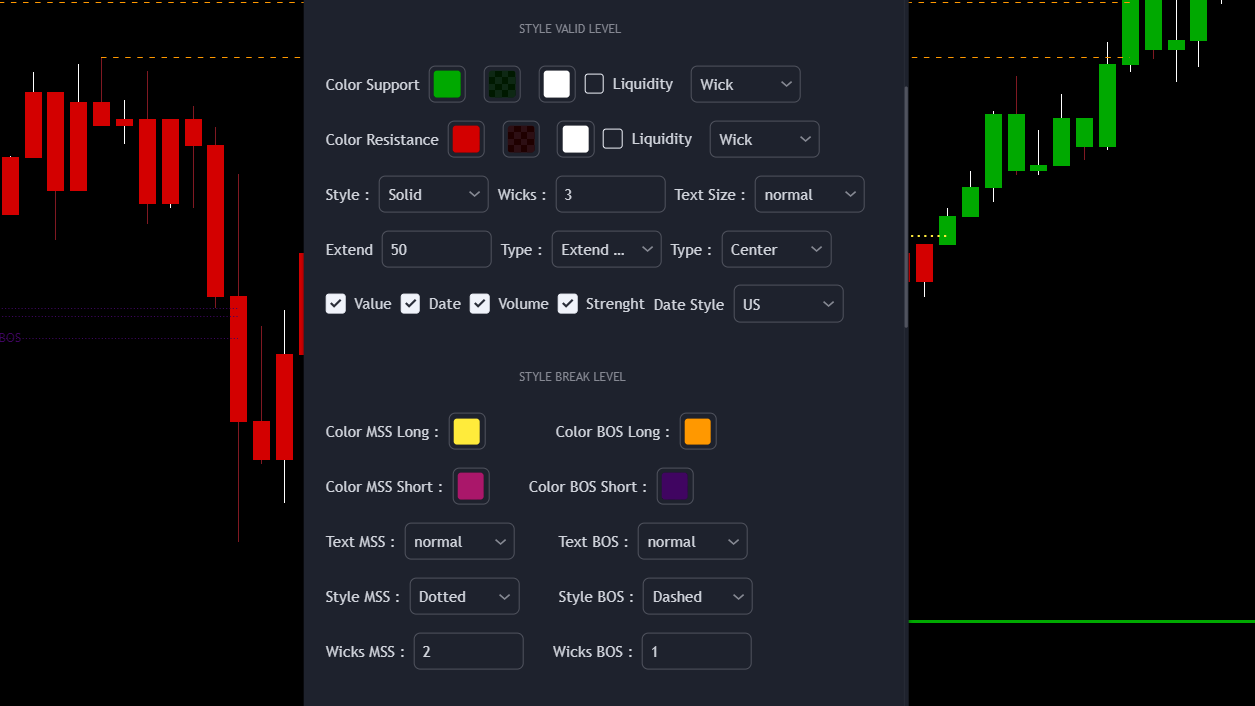
Level Style and Colors
Customize the colors and line style for each level type, making visual interpretation clearer and more intuitive.
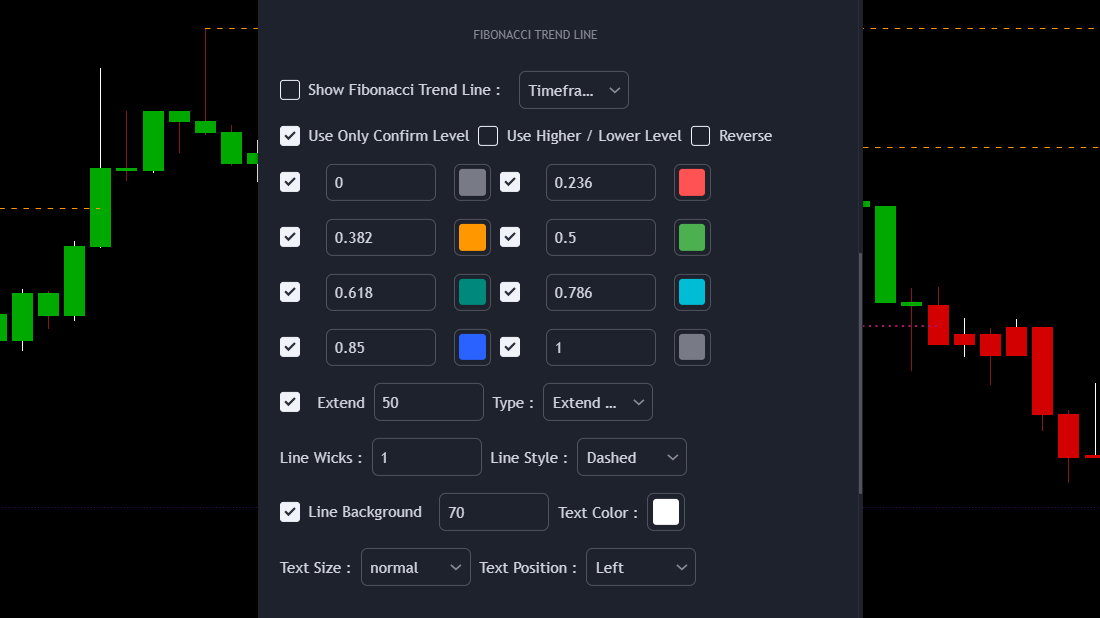
Fibonacci Levels
Add Fibonacci levels based on the last two identified support and resistance levels. Customize the different levels and their colors to integrate perfectly with your analysis scheme.
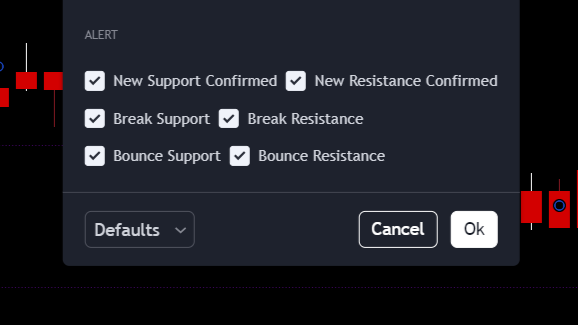
Personalized Alerts
Set configurable alerts to be notified of breakouts, bounces, or the creation of new levels. This feature allows you to stay updated on market dynamics without having to constantly monitor the chart.
How to Use Support and Resistance
Support and Resistance offers features that help traders understand and make the most of critical market levels.
Consider all levels displayed on the chart as magnetic points for price, as they represent critical areas where the market tends to react.
Support and Resistance Specific Questions
Yes, the indicator works on any timeframe equal to or greater than the chart's, but levels identified on higher timeframes tend to be stronger and more relevant.